


Price :
QTY :
CART TOTALS :
There are items
in your cart
CART TOTALS :
With this products also buy:
Your shopping bag is empty
Go to the shopWith a grant from the Missouri Department of Conservation, Great Rivers Habitat Alliance undertook an analysis of properties in the Saint Louis region near rivers and other wetlands. The goal of this study was to identify parcels in St. Charles, St. Louis, Lincoln, and Pike counties as well as the city of St. Louis that are ecologically significant. The following section explains the multivariate analysis used to determine each parcel’s ecological significance ranking.
All of the datasets listed below are ones that have been designated as important factors when considering which parcels are more valuable than others for targeting for purchase. A parcel receives points if any part of it overlaps with any of the datasets listed below, excepting those in the “Proximity” category. Parcels must either be adjacent to or within a certain distance of the datasets in Proximity category in order to be awarded points (see below for details). Since some of the factors are more important than others, a parcel may receive a different number of points for overlapping different datasets. The datasets are split into 5 different categories based on their importance, and each dataset within a category contributes the same number of points to any parcel that overlaps it.
For example, a parcel may overlap wetland, 100 year floodplain, and designated Candidate Ecological Restoration Area, as well as be within 0.5 miles of a road. Since wetland and 100 year floodplain are both in the Primary Ecologically Important category, they each contribute 3.5 points to the parcel’s ranking, giving it 7 points. Candidate Ecological Restoration Area is in the Areas of Investment category and therefore contributes 2 points to the parcel’s score, bringing its score to 9 points. Road access (or being within 0.5 miles of a road) gives the parcel 1 additional point, bringing its final score to 10 points. Each parcel’s score is calculated in this manner, adding points for each dataset/factor that it overlaps with, and the total score being its final ranking.
The percentage of overlap is not taken into consideration. A parcel may only slightly overlap one of the datasets while another overlaps the same dataset entirely, and both parcels would receive the same number of designated points.
The following is the list of datasets used to rank the parcels, including which category of importance they fall into, and how many points they contribute to any overlapping parcel:
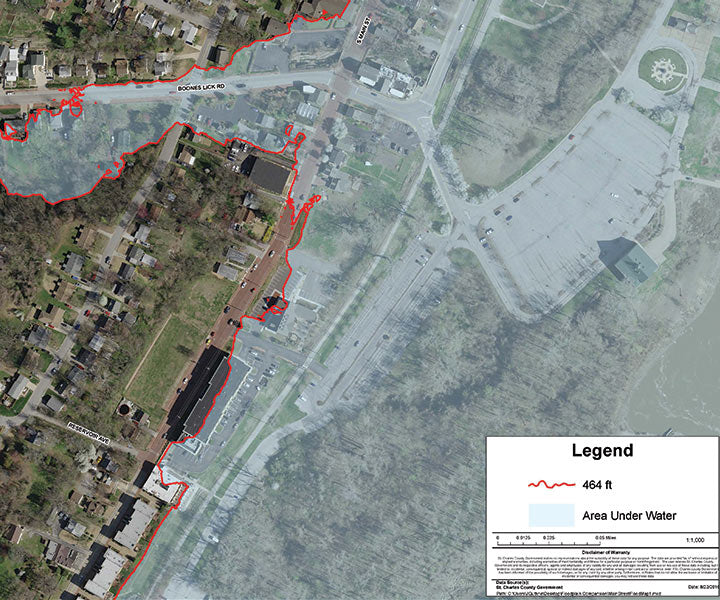
This ranking results in scores ranging from 0 (least ecologically significant) to 32.5 (most ecologically significant). Government lands are excluded from this analysis and, therefore, colored green in the following maps.
Documents:
Vision of long term preservation of the Confluence region sets out a concept of a joint venture partnership.
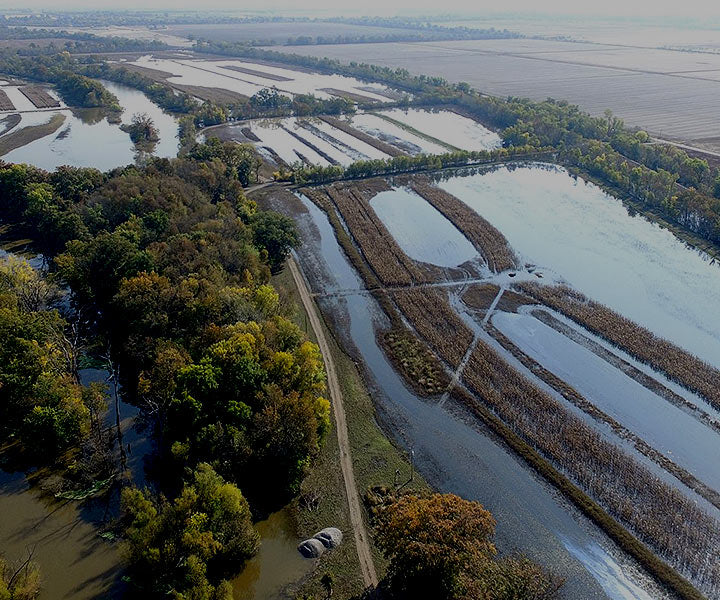
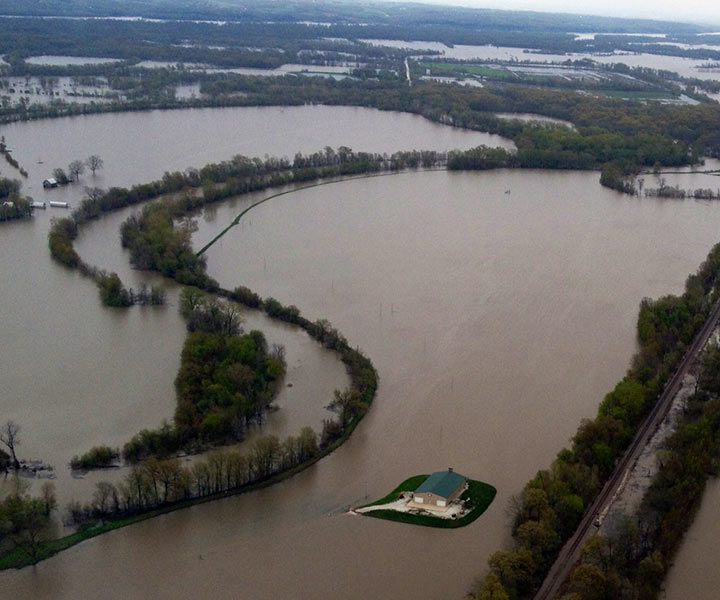
To address flooding, GRHA is working with local leadership to tackle the issue of floodplain rise and the filling of the floodplain and develop regional approach for managing flood losses while protecting and restoring benefits of floodplains.
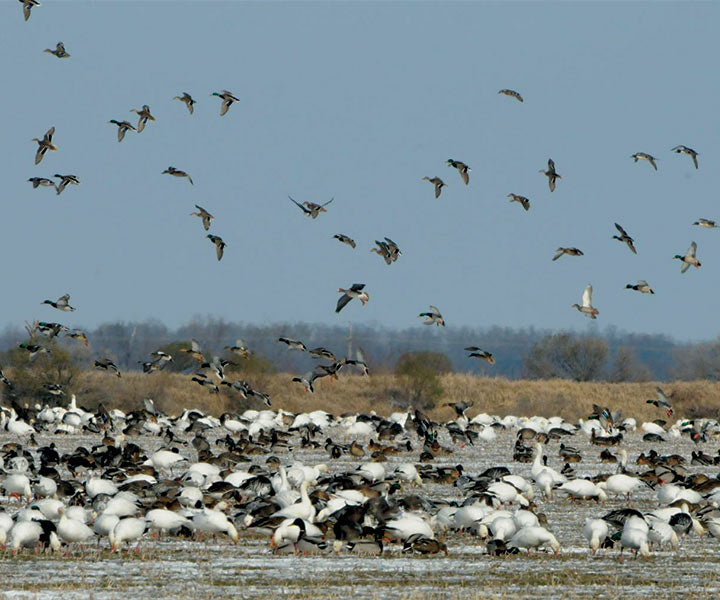
Home to approximately 241 fish species, 50 mammal species, 45 reptile and amphibian species, 37 species of mussels, and 60% of migratory birds occupy the MS Flyway.
St. Charles County floodplain held more than thirty billion cubic feet of water during the peak of the great 1993 flood. Imagine if this water were pushed down stream.
A selection of maps from the Great Rivers Habitat Alliance map room. Please direct any questions about these maps please contact us.
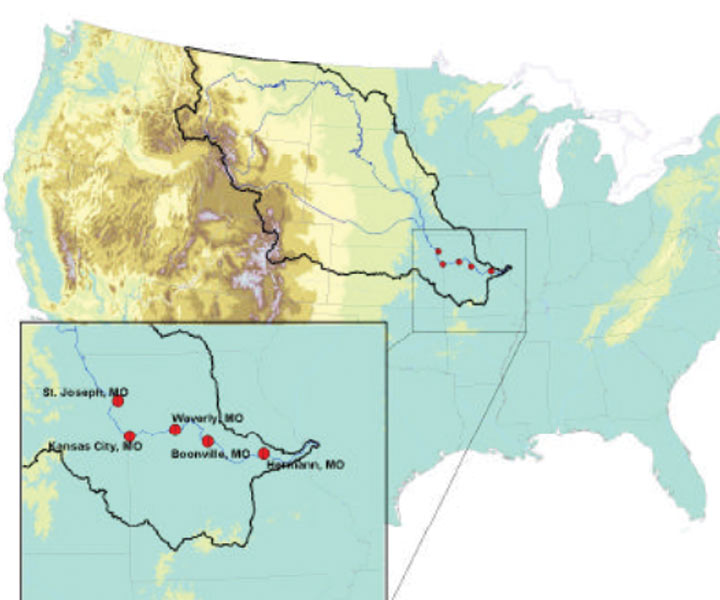
Five stations along the Lower Missouri River were examined using specific-gage analysis (SGA)